COSMIC
PATTERNS SOFTWARE, INC.| WWW.ASTROSOFTWARE.COM
COSMIC
PATTERNS SOFTWARE, INC.| WWW.ASTROSOFTWARE.COM
| PRODUCTS | SERVICES | INFORMATION/EDUCATION | COMPANY | PURCHASE | YOUR ASTROLOGY REPORT! | CONTACT US |
Click on the link below to view more features: |
OTHER SPECIAL FEATURES:
|
|
|

|
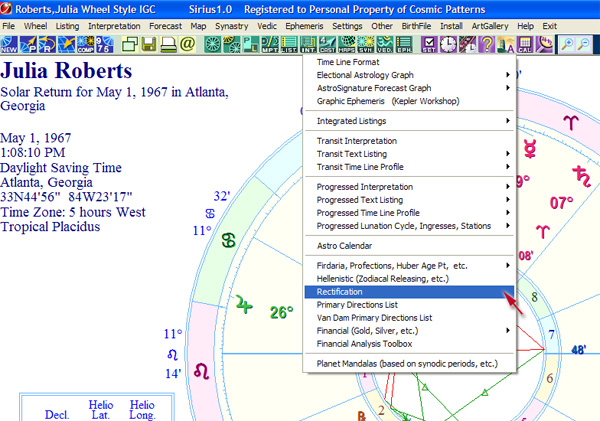
The Rectification feature of Sirius analyzes all astrological influences related to life changing events in a person's life and then produces a graph of the likelihood that the person was born at various times. What could take an astrologer days or even weeks to calculate can be assembled in minutes and graphed in a clear and concise manner! Flexibility: To rectify a chart in Sirius, simply click on "Forecast" or click on the Forecast icon then select "Rectification". Rectifying a chrt requires at least 5 very important and life changing recorded events in the person's life. Entering these events in Sirius recitification assist is also extremely easy. Most common events are already lsited for you or you can create your own event easily. Selecting a forecasting method to use is also very easy. Simply select the calculation technique that you want to use on the left side of the screen. If you are not sure the technique to use and you are new to astrology, simply give us a call or send us an e-mail so we can recommend which methods to use. Below are some Rectification windows in Sirus:
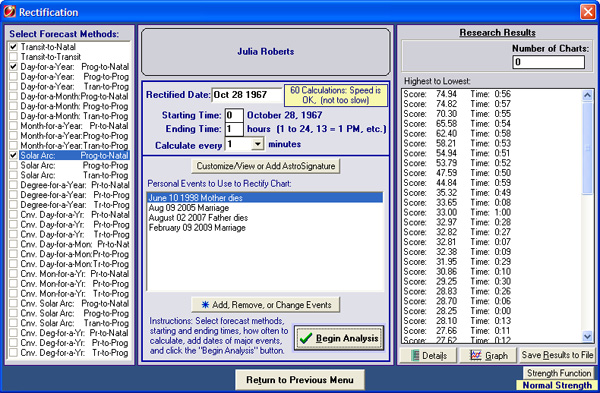
After you clicked on "Rectification" (as shown above), you will see the Rectification window, In the "Select Forecast Method" box, select the rectification forecast methods by clicking on the list. Select at least 3-5 forecast methods or select whatever method(s) you wish to use.
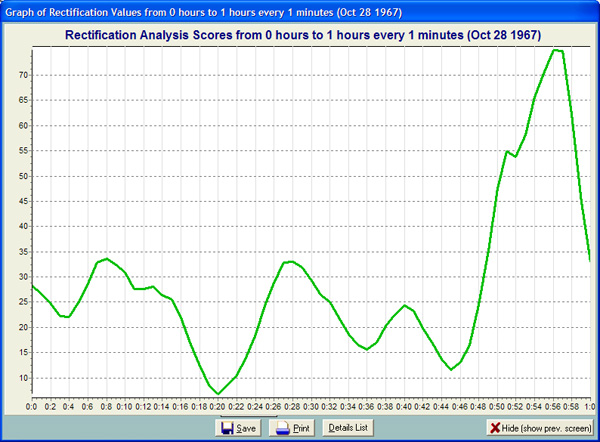
After entering important events, you are now ready to rectify the chart. The resulft is provided in graph and list format shown below.
Below is the window with the list of Scores of each time calculated. The calculated 24 hours is not shown but there is a scrolling side which you can scroll to view the scores of all calculated time. The graph can either be printed, save to file, or both. If you click on the "Details" button, a window with detailed list is displayed.
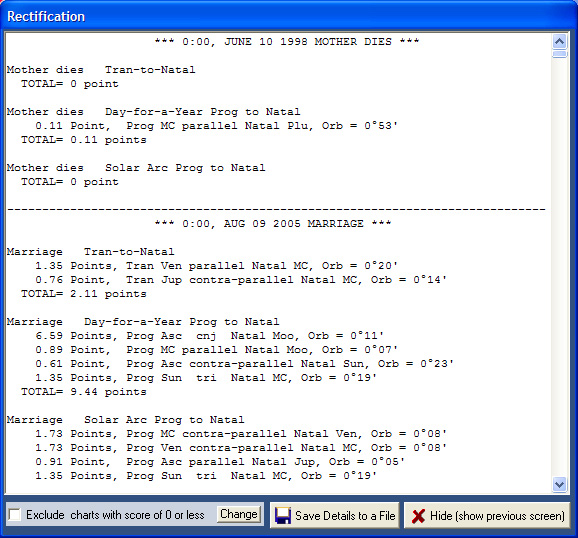
In this windows (shown below) contains a detailed list of all the calculated dates and time. Because the window issmall, a scrolling up and down arrow is provided.
|