 COSMIC
PATTERNS SOFTWARE, INC.| WWW.ASTROSOFTWARE.COM
| PRODUCTS | SERVICES | INFORMATION/EDUCATION | COMPANY | PURCHASE | YOUR ASTROLOGY REPORT! | CONTACT US |
Click on the link below to view more features: |
OTHER SPECIAL FEATURES:
|
 Sirius is
Simply The World's Most Powerful And Easiest To Use Astrology Software!
Extraordinarily Flexible and Customizable. Quickly Access The Charts
And Reports You Need, And Also Have A Wealth of Additional Tools Available. Sirius is
Simply The World's Most Powerful And Easiest To Use Astrology Software!
Extraordinarily Flexible and Customizable. Quickly Access The Charts
And Reports You Need, And Also Have A Wealth of Additional Tools Available. |
![]() SIRIUS
FINANCIAL ASTROLOGY: (from
Page 2)
SIRIUS
FINANCIAL ASTROLOGY: (from
Page 2)
Financial Astrology Features of Sirius 1.0
Overview: Sirius is an extraordinarily large and comprehensive software package with advanced features in nearly every area of astrology. The features for financial astrology are very powerful, elegant, and innovative. Software, information, newsletters, books and other information for financial analysis, including astrological financial analysis, tend to be rather expensive, and Sirius is relatively very inexpensive. The relatively low price of Sirius can unfortunately cause some people to be unaware of the rich set of powerful tools for financial astrological analysis provided in Sirius. The primary tools for financial astrology provided in Sirius are: 1. A database of company incorporation and first trade charts.
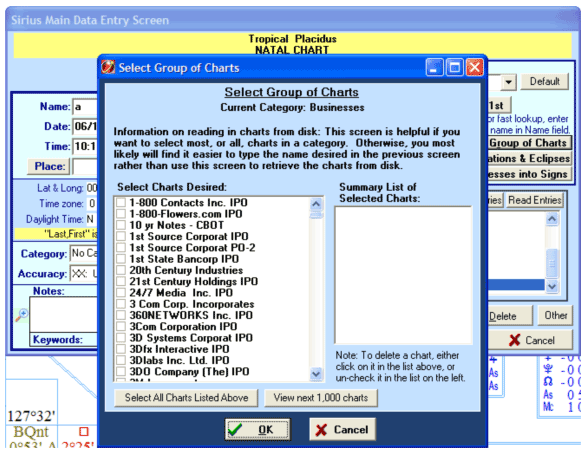
BELOW IS THE DESCRIPTION OF EACH OF THE 7 ITEMS LISTED ABOVE 1. Database of Company Incorporation and First Trade Charts: Sirius includes birth data of charts of a few thousand company incorporation and first trade charts. Astrologers frequently analyze an incorporation or first trade chart in a similar way to how the birth chart of a person would be interpreted in order to better understand the nature of the company. Sirius includes a total of over 46,000 charts and you can also filter the chart data in the data entry screen to see only the company data by selecting the company data category of charts. Shown below is the Sirius data entry screen. In the upper right corner of the data entry screen, the “File to Read” field was clicked, and then the category of All Businesses was selected, and then the “Get Group of Charts” button was selected. This allows us to see all the business chart data and to select the charts desired by checking them. The list is alphabetical, with company names beginning with numerals followed by the alphabetical list from A to Z. On this screen we can scroll the first thousand charts or select the “View next 1,000 charts” button to view and select from the next thousands charts. Note that this feature is used simply for viewing the charts of individual companies. The most powerful and useful features in Sirius for financial analysis are descrbied in sections 3, 4, and 5 below. Although the selection of incorporation and first trade charts is not the most powerful and useful feature in Sirius for most users, it is a helpful feature. Note that selecting a category of charts and then selecting the “Get a Group” button is a useful feature for selecting a group of charts or finding charts within any category group, not just the company incorporation and initial public offering charts.
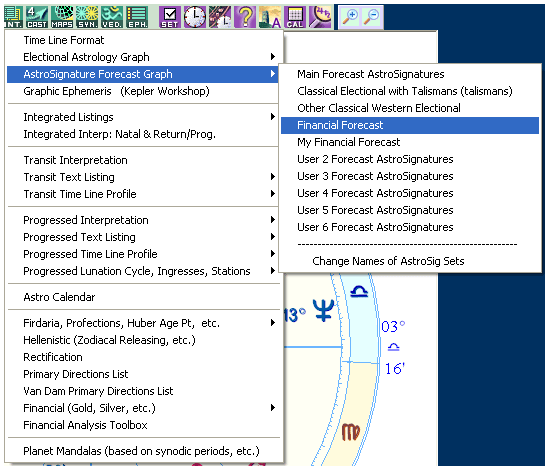
2. Stock price data The most powerful feature of Sirius for doing financial analysis is the ability of Sirius to graph price data and the forecasted price data and instantly see the correlation between the forecasted and actual data, combined with excellent tools for discovering a valid AstroSignature upon which to base the forecast. In order to do this financial analysis, you must have price data. The price data can be the stock prices for a specific company, an overall indicator of economic activity, such as the values of the Gross National Product for a country, or the Dow Jones Industrial Average, or other market index. The price data could also be the price of a commodity, such as the price of copper. Nearly any performance data could be used, including non-financial performance data such as the batting average of a baseball player at every game played. For the best results, a few hundred or more performance values can be helpful, and especially helpful is if the performance occurs regularly for the time period analyzed. Financial price data typically is provided every day except Saturday, Sunday, and holidays once a day. Although a daily price including weekends and holidays would be even better for analytical purposes, the price data is sufficiently regular to be excellent for use with the research tools provided in Sirius. Sirius comes with stock price data for hundreds of companies so you do not need to obtain data from other sources to begin working with the financial features in Sirius. Sirius also has the ability to import price data from companies that sell price data. To import the data into Sirius, you export the data provided the company to a text (ASCII) format. Sirius can import most text formats which data is exported to. In the very unlikely case that you encounter a format not supported by Sirius, you can e-mail us a few lines of the data from the file, and we can look into adding this format. Sirius also automatically associates the appropriate stock price data with the appropriate chart. For example, in the data entry screen I can read in the chart of Yahoo! Inc., and then select the Forecast icon, and then select either the Electional Forecast and AstroSignature Forecast, and then select one of the kinds of forecasts; Financial Forecast would make sense in this case. Shown below is a screen capture of this selection being made:
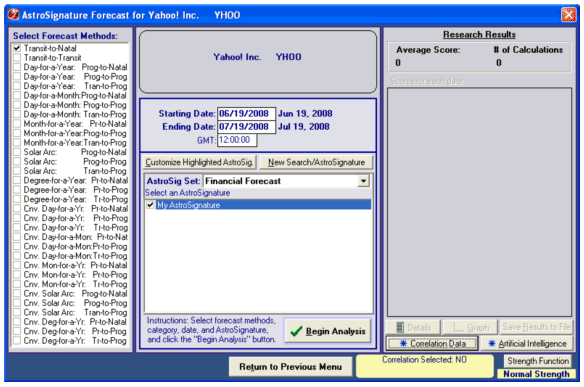
In the screen display shown above “AstroSignature Forecast Graph” is selected after clicking on the Forecast icon. The “AstroSignature Forecast Graph” and the “Electional Astrology Graph” are essentially the same thing. The only difference between the two is that the AstroSignature Forecast defaults to a selection of Transit-to-Natal influences and the Electional Astrology Graph defaults to a selection of Transit-to-Transit influences, as shown below. The screen display shown below is the window displayed after making these selections.
Now we can select the “Correlation Data” button near the lower right corner of this window to select price data. The screen that appears after clicking the “Correlation Data” button is show below.
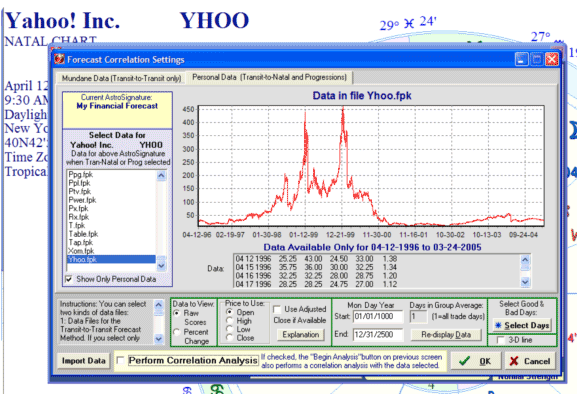
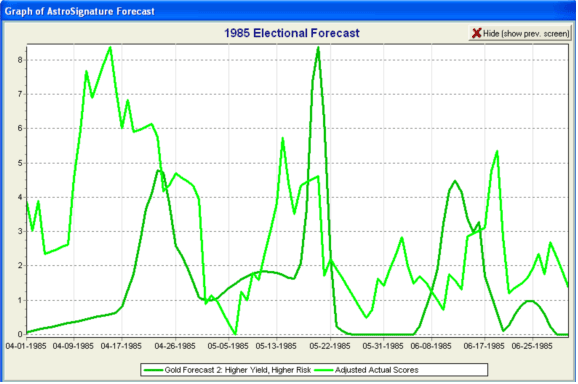
Because we are viewing the chart of Yahoo! Inc that we read from the file (and that we have already selected the price data file YHOO.FPK to associate with this chart before the Sirius program was shipped to you), the file YHOO.FPK is automatically selected and we also see a graph of the Yahoo stock prices. Now all we have to do is check “Perform Correlation Analysis” on this screen, click the OK button to return to the previous screen, and select a forecast within the range of dates for which we have data (April 12, 1996 to March 24, 2005 as noted in the screen display above below the graph and above the scrolling list of price data), and then a graph of both the actual prices and the forecasted prices will be produced, as well as the correlation value (from -1 to +1) between the forecasted and actual forecasts. However, this raises the question: “How can I determine what astrological influences are in effect that cause the prices to go up so that I can create an accurate forecast?” Sirius provides the tools to find the astrological influences. The first step that I use to determine the astrological influences that cause a change in prices is to analyze charts when prices have reached a peak or a low. The procedure for extacting and creating these charts is described below. 3. Extract Data and Create Charts for Days when Prices are High, Low, Rise Dramatically, or Fall Dramatically: On the screen display shown above which shows the price data for Yahoo! Inc., there is an “Import Data” button in the lower left corner of the window. Click this button to import new price data. As mentioned in Section #2 above, “Stock price data”, you can import additional price data into Sirius. Clicking this button opens the window to do this. Our interest now, however, is to determine days when prices are high, low, or change by a large amount. To do this, click the “Select Days” button near the lower right corner of the screen. Note also that there is a choice of “Raw Scores” and “Percent Change”. If “Raw Scores” is selected, then a window is displayed for selecting dates when prices reach a peak or a trough, and if “Percent Change” is selected, then dates when prices go up or down by a large percent is displayed. You have control over the parameters for these values (number of days in a moving average, etc.) and you can place the data in a category that you create. The details of making these selections are given in the Help system provided with Sirius. 4. Research Tools for Discovering Astrological Factors in a Set of Charts: Now that we have created a group of charts when, for example, prices reach a peak, we can analyze these charts to see what astrological influences occur in these charts more often than on other days. Some of the research tools for discovering astrological influences in a group of charts are described very thoroughly in an article on the Gauquelin data, which you can read by clicking on this link: http://www.astrosoftware.com/DISCOVERY.HTM If you are serious about conducting astrological research that is sophisticated and sound, I strongly recommend that you read this article. Precisely the same principles described in this article can be applied to analyzing the charts for days when a price reaches a peak (or a low, or upward or downward change in price). This article on the astrological influences in the Gauquelin data also describes how to create an AstroSignature based on your findings. After discovering the factors that occur in the charts and making a Forecast AstroSignature based on these findings, you are now ready to test the accuracy of your forecast. 5. AstroSignature Forecast with the Correlation Value of the Predicted and Actual Prices: Using the procedures described above, I developed an AstroSignature for forecasting gold prices. You can purchase this AstroSignature and be able to produce your own Gold Forecast using this AstroSignature. This AstroSignature is provided in the Gold Forecast Report option to the Sirius program. Show below is a graph produced with the Gold Forecast Report for a 3-month period:
As you can see from the legend shown below the graph, the dark green line is the forecasted prices and the light green line is the actual scores adjusted to fit within the range of predicted socres so that the graphs can be easily compared. In Sirius there are additional windows that can be accessed while viewing this graph: there is a window for viewing the daily scores and the astrological influences in effect for each day, so that you can see the specific details that contribute to the resulting graph. This window of details is very helpful for analyzing and understanding the astrological influences that are in effect at any given time. Also displayed is the correlation value between the predicted and actual scores. For the above graph the correlation is .08 (positive 8 percent). Although an 8 percent correlation may not seem very high, visually you can see that there are some general similarities between the predicted and actual graphs. 6. Other Research Features: In addition to the research features described in the article on astrological factors in the Gauquelin data, there are other research features such as analyzing planets aspecting fixed stars, degree areas of the zodiac, etc. With the AstroSignature research feature, rulerships of planets and other astrological influences can also be included in the research. 7. Other Features that are Helpful for Financial Research: When developing the Gold Forecast, I sometimes ran transit-to-transit listings for particular aspects between a pair of planets or a time line format forecast, and I sometimes viewed a chart of a particular high peak date of gold prices. There are an enormous number of features that the person who has a good knowledge of astrology can use to help in the understanding of the astrological influences that affect gold prices. For the person who is pursuing this research with a background in economics or finance but has little knowledge of astrology, the Avalon lessons and also the AstroEncyclopedia feature of Sirius are extremely helpful. Even professionals and advanced students find some of the advanced topis in the lessons and AstroEncyclopedia to be very helpful. |
- CLICK HERE TO READ MORE ABOUT SIRIUS! (Proceed
to Page 3)
